|
|
|
Wekiva
River
|
|
|
|
Subsurface
Characterization
|
|
As
often encountered during surveys of rivers in this area,
the data quality is generally poor. The common problem
is the rivers are shallow and acoustic echoes from the
river banks add to noise in the signal which obscure any
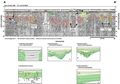
subsurface features. Profiles A-A’
and B-B’ are
two examples where some subsurface features can be seen.
Profile A-A’
shows a subsurface depression at depth that has been filled,
similar to a type 3 karst feature. Throughout the profile
several type 4 dissolution features appear to be present.
Horizontal reflections at the nearsurface (green lines)
may represent more recent fill. Profile B-B’
exhibits a persistent reflection (blue line) throughout
the profile that may represent a horizon within the Hawthorn
Group or the contact between the Group and overlying undifferentiated
sands and clays. The left side of the profile shows an
area of disturbance in the subsurface, where type 4 dissolution
features may be present. These features are characterized
as distinct parallel and sub-parallel reflections with
a higher amplitude than the surrounding material and may
represent filled solution pipes. It appears that some
subsidence has occurred with subsequent fill to the present
day river bottom, however, the discontinuities at depth
do not reach the present day river bottom and may not
affect the more recent fill.
|
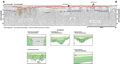
The
natural gamma log cross section A-A’
shown on Index Map E
shows the elevation of the top of the Ocala Limestone
in wells OR0652
(-40 m [-130 ft] NGVD) and L-0037B
(-43 m [-140 ft] NGVD), below resolvable depth in the
seismic records. The areas of disturbance seen in the
profiles may represent areas of subsidence within the
Hawthorn Group as it accommodates dissolution in the underlying
limestone. The gamma log cross sections show how variable
the sand and clay units within the Hawthorn Group and
overlying undifferentiated sediments are. Peaks in the
gamma logs are not laterally continuous and the thickness
varies considerably.
|
|
|
|