|
|
|
Methods
|
|
Seismic
Profiling
|
|
The
Elics Delph2*
High-Resolution Seismic Profile System (HRSP) was
acquired with proprietary hardware and software running
in real time on an Industrial Computer Corporation 486/33
PC (Fig. 2).
A gray scale thermal plotter was used to display hard-copy
data. Digital data were stored on a rewritable magneto-optical
compact disk. Navigation data were collected using a Trimble
Global Positioning System (GPS) or Rockwell Precision
Lightweight GPS Receiver (PLGR) these systems provide
navigational accuracies of ±10 m. GeoLink XDS mapping
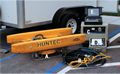
software was used to display navigation. The acoustic
source was an electromechanical device, the Huntec Model
4425 Seismic Source Module mounted on a catamaran sled
(Fig. 2).
Occasionally, an ORE Geopulse power supply was substituted
for the Huntec Model 4425 due to operational limitations.
Power settings were 60 joules or 135 joules depending
upon data quality during acquisition. An Innovative Transducers
Inc. ST-5 multi-element hydrophone was used to detect
the return acoustical pulse. This pulse was fed directly
into the Elics Delph2 system for storage and processing.
|
The
Elics Delph2 Geophysical System measures and displays
two-way travel time (TWTT) of the acoustical pulse in
milliseconds (ms). Amplitude and velocity of the signal
are affected by variations in lithology of the underlying
strata. Laterally consistent amplitude changes (lithologic
contacts) are displayed as continuous horizons on the
seismic profiles. Depth to horizon is determined from
the TWTT, adjusted to the subsurface velocity of the signal.
Suggested compressional velocities for Hawthorn Group
sediments for the Florida Platform range from 1500 to
1800 meters per second (m/s) (Tihansky, pers. comm.; Sacks
and others, 1991). Refraction studies conducted in
areas within Alachua County, Florida (Wiener,
1982) yielded velocities of 1707 to 4939 m/s for the
Hawthorn Group sediments. Wiener,
(1982), reported lower velocities for the sand and
clay sediments and higher velocities for the carbonate
sediments. To correlate horizons from gamma logs to seismic
profiles, best-fit-curve plots were used to determine
local velocities (Fig.
3).
|
More
than 750 line-km of data were collected from >40 lakes,
rivers and offshore sites, only 34 are presented in this
study (Table
1). Best-fit-curves
were used to compare well-log depths and seismic depths
but an approximate velocity of 1500 m/s was used as a
general calculation for depth scales on the HRSP data.
Data quality varied from good to poor with different areas
and varying conditions. As acquisition techniques improved,
data quality in general also improved. The interbedded
nature of the lake bottom sediments provides good reflecting
surfaces for acoustic signals. These layers appear on
the seismic records as convergent, divergent, or parallel
bands. Folds, faults and facies changes can be recognized
as bands, lateral and vertical discontinuities, and truncations
of the bands by other reflections. In some areas, acoustic
multiple-reflections masked much of the shallow geologic
data. Multiple reflections, an artifact of the acquisition
system, are caused by a number of possible factors that
reflect the acoustic signal to the water surface and back
down more than once.
|
|
|
|