|
|
|
Crescent
Beach Spring
|
|
|
|
Subsurface
Characterization
|
|
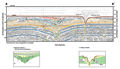
Numerous
transects across Crescent Beach spring were conducted
in 1994 to acquire HRSP of the subsurface. Two examples
of the profiles are shown as A-A’
and B-B’.
Unfortunately the navigational fixes attached to the digital
seismic data have been lost, so horizontal scale of the
profiles and their geographic location cannot be determined
at this time. Another survey of the sink using Side-Scan
Sonar, HRSP and a fathometer were done in 1998.
|
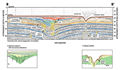
The
seismic profiles (A-A’
and B-B’)
show numerous strong, parallel reflections from about
30 m (98 ft) to 60 m (197 ft) below sea level. Gamma log
profiles (Index Map
H), interpreted from Gamma counts acquired from inland
wells drilled within eight kilometers of the spring show
numerous peaks in gamma counts at the base of the Hawthorn
Group. These peaks are at similar depths to the strong
reflections in the seismic profiles. The package of reflections
highlighted by an orange background (A-A’
and B-B’)
exhibits a slightly more “noisy” characteristic
than adjoining reflections and may represent different
lithologic or stratigraphic parameters. The series may
correlate with the higher frequency gamma count peaks
seen in gamma log profiles SJ0798
and SJ0171 between
-21 m (-70 ft) and -30 m (-100 ft). Below 60 m (197 ft)
the strong reflections diminish in the seismic profile
(not shown). This change in acoustic return may represent
the top of the Ocala Limestone. In the gamma profiles
this surface is indicated by a blue line and ranges from
an elevation of -53 m NGVD (71 ms or -170 ft) at SJ0151
to -69 m NGVD (92 ms or -220 ft) at SJ0162.
Though there is insufficient data to confirm the identity
of one reflecting horizon as the top of the Ocala Limestone,
it is most likely around 70 ms (53 m, 174 ft) on the seismic
data.
|
|
|
|