|
|
|
Lake
Harney
|
|
|
|
Subsurface
Characterization
|
|
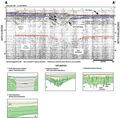
Seismic
profiles from Lake Harney show a good example of subsurface
karst imaging (A-A’,
B-B’). Profile
A-A’ shows a
deep reflective surface (red line) with apparent subsidence.
This feature is similar to a type 3 feature described
in the explanation. This subsidence influences the integrity
of the overlying strata, as shown in subsequent collapse
across another reflective surface (blue line). Profile
B-B’ shows another
deep collapse structure (red line). Within this subsidence,
horizontal reflections onlap the steeper sides of the
structure. This may represent fluvial or aeolian infilling
of the depression. This type of infilling may have also
occurred in the shallower depression shown in profile
A-A’, as evidenced
by the patterned texture of the acoustic signal from the
overlying material. This pattern could represent foresets
or cross-bedding, as opposed to collapse-type infilling,
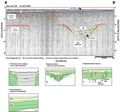
which typically returns a noisier or chaotic signal. Comparison
of the deeper subsidence structures between profiles A-A’
and B-B’ may
provide insight into the timing relationships between
collapse in the host rock and subsidence in the overburden.
The deeper structure in profile A-A’
does not appear to have the infilling seen in the B-B’
subsidence. Also, the overburden in profile A-A’
appears to be more disrupted than that overlying the subsidence
in profile B-B’.
The infilling might indicate that the deeper subsidence
seen in profile B-B’
may be a relic sinkhole that was aerially exposed and
filled prior to accumulation of the overburden. The structure
in profile A-A’
represents a continued subsidence, controlled by the deeper
featured. The disruption in the overburden in A-A’
further supports continued subsidence, whereas the overburden
in profile B-B’
appears to be undisturbed.
|
Gamma
logs to the west of Lake Harney show the top of the Ocala
Limestone at about 12 m below mean sea level along the
southern portion of the lake (Index
Map E). This depth correlates well with the red reflections
seen in the profiles. The deep structures may represent
collapse in the Ocala. Likewise, the blue reflections
in the profiles may represent material in the Hawthorn
Group. High angle reflections (orange and gold) may represent
stress in the overburden and indicate breaches through
the otherwise impermeable Hawthorn sediments.
|
|
|
|