|
|
|
Lake
Dias
|
|
|
|
Subsurface
Characterization
|
|
|
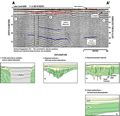
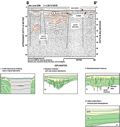
Seismic
profiles from Lake Dias are predominantly obscured at depth.
A strong bottom reflection leads to multiples seen throughout
the data that obscure some of the record in the deeper portions
of the lake (C-C’).
The record is also partially obscured in areas where the
lake bottom nears the surface (A-A’,
B-B’). In general
the lake is characterized as a single large depression comprising
most of the lake (Distribution
of Features, blue line). Deep reflections tend to drop
prior to becoming obscured near the central portions of
the lake (B-B’,
blue lines). This suggests that deep structures influence
the lake bathymetry. Low-amplitude, near surface reflections
in some of the profiles near the fringes of the lake have
a hummocky appearance (index map, type 4, A-A’,
B-B’, red lines).
The reflections may represent smaller subsidence features
in the fill overlying the deeper subsidence. Profile C-C’
also shows some low angle, offlap type reflections (type
6 , red lines) that may represent subsequent fill during
subsidence of the lake.
|
|
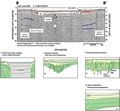
Profile
D-D’ shows a feature
seen in the extreme northeastern portion of the lake. Pronounced
high angle reflections (red lines), overlain by fill-type
horizontal reflections (orange lines) may represent a collapse
structure (type 3). A chaotic signal below the horizontal
reflections could be block fill associated with the initial
collapse, which was subsequently overlain by fluvial fill.
This is the only area throughout the lake where this type
feature is present and could represent a major breach in
the confining material overlying the aquifer.
|
|
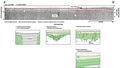
Interpretations
of gamma profiles from wells surrounding the lake (Index
Map D, C-C’)
show the top of the Ocala Limestone to be between -9 and
-15 m (-20 and -50 ft) NGVD. This would correspond to between
26 and 35 milliseconds depth in the profiles, using an averaged
sound velocity of 1500 m/s. This depth would suggest that
the blue lines seen in the profiles (A-A’,
B-B’) represent
horizons near the top of the Ocala Limestone. Dissolution
in the Ocala Limestone at depth would cause subsidence in
the overlying material and fill.
|
|
|
|