|
|
|
Lake
Weir
|
|
|
|
Subsurface
Characterization
|
|
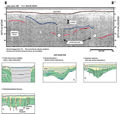
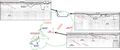
The
subsurface disturbance features visible in seismic profiles
acquired from Lake Weir generally fall into subsidence
type categories (2 and 3) at two different depth levels
(Location of Possible
Subsidence). The deeper structures could possibly
correspond to subsidence within the Hawthorn Group (B-B’),
but detail is obscured by noise in the overlying record.
Near-surface features show low-angle reflections that
exhibit disturbed bedding (blue lines in profiles). Relationships
between the upper and lower features are seldom apparent
due to the generally poor acoustic return. Large areas
in the central portion of the lake show a gassed out appearance.
This could be due to a hard, sandy lake bottom or high
organic content in the surficial sediments. The seismic
records to the west show strong multiples, which also
obscure the underlying record. This could also be due
to a hard sandy lake bottom. Surface features include
obvious dredge canals along the northern shore and a very
large, long dredge-like structure across Little Lake Weir
(A-A’). This feature
is up to 300 m (984 ft) wide and 3 m (9.8 ft) deep (6
m, 19.7 ft water depth). It cannot be determined from
the record whether this is a dredge canal or collapse
structure. Possible near-surface faulting (red dashed
lines) and what could be a real reflection dipping beneath
the multiple could indicate subsidence in the area.
|
The
top of the Ocala Limestone plunges to the east beneath
Lake Weir, as indicated from interpretations of gamma-log
profiles obtained from wells around the lake. The Ocala
surface is at 4.6 m (15 ft) NGVD on the southwest side
of the lake (well M-0070,
Index Map C) and
decreases to about 30.5 m (-100 ft) NVGD on the east side
(M-0079, M-0080).
A well north of the lake (M-0078)
shows the contact to be at -5 feet NGVD. This irregular
surface may indicate mature karst development beneath
Lake Weir and the disturbed nature of the reflective horizons
shown in seismic profile B-B’
(blue and red lines) could be a result of more recent
subsidence in the overburden. Well logs indicate that
the Hawthorn Group crop out on the west side of the lake
and dip to around zero feet NGVD to the east. This corresponds
to approximately 16 m depth in seismic profile B-B’
and would suggest the reflective horizons represented
by the red and blue lines in the profile to correlate
with the top of the Hawthorn Group.
|
|
|
|